
Identifying growth KPIs that are leading indicators of product success

Imagine you run a lemonade stand. You meticulously track how many people purchase from your stand each week, because that’s how you make money. For the first two months, the number increased without fail. Then, as if you took a false step on your hike to profit, it started tumbling down the hill.
What happened? And how did you not see it coming?
After sitting down with some trusted friends and family members, they broke the news that your lemonade simply wasn’t any good. If you had been paying closer attention, very few people came back for a second glass. The overly-sour taste was enough to send them down the side street to your neighborhood competitor. And without the repeat business, you not only lost your initial customers, but also spoiled your reputation such that it was hard to find new ones.
All of this could have been avoided if you’d been tracking leading indicators of success, were monitoring these metrics properly, and had experimented with new ways to improve your product (the lemonade) and growth strategy (luring in thirsty neighbors).
Identifying product and growth metrics that fit your business
The customer lifecycle is fairly standard across products: users first must show up, then be activated in some way. From there, they become active users, at which point their value is determined by the level of their engagement and whether they stick around long-term.
These stages map directly to specific metrics categories that we recommend to all of our customers: reach, activation, active usage, engagement, and retention.
When identifying your key performance indicators (KPIs), it’s crucial to tailor the exact definition to your business. For example, what does it mean to be “active” in your product? No stock definition or out-of-the-box dashboard can capture this for you.
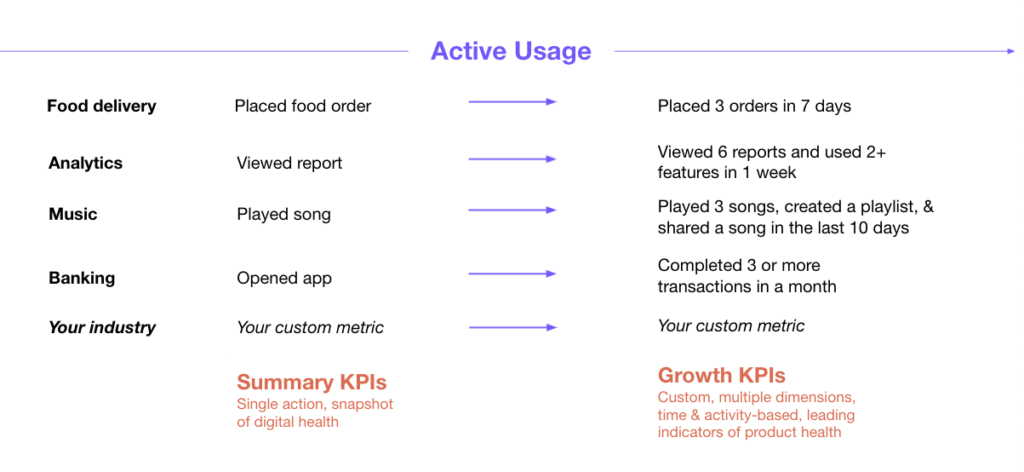
Summary KPIs vs. Growth KPIs
The most successful companies set themselves apart by how sophisticated they are in defining their KPIs. They assess themselves at multiple levels, using Summary KPIs for a snapshot of digital health, in addition to Growth KPIs for a leading indication of long-term product success.
To take the active usage example one step further, what series of behaviors defines users who are likely to stay around in the long run? Acquisition can be quite expensive, and the easiest customers to retain and monetize are the ones you already have.
With the right growth KPI in place for active usage, you make a tangible impact on the business when you improve the number.

Let’s go back to the lemonade stand. Understanding total weekly customers was helpful, but not enough. It didn’t reflect the level of customer engagement and repeat business, which are the keys to sustainable growth.
Let’s say you dug into your data and found that people who came back 3 times in a 7-day period were likely to become loyal, long-term customers. Making that a growth KPI would have shown a dip in your operation fairly early on, signaling a need for some changes.
This same concept of identifying growth KPIs tied to long-term success applies to any industry. Here are some examples:
Turning a metric into something you can analyze
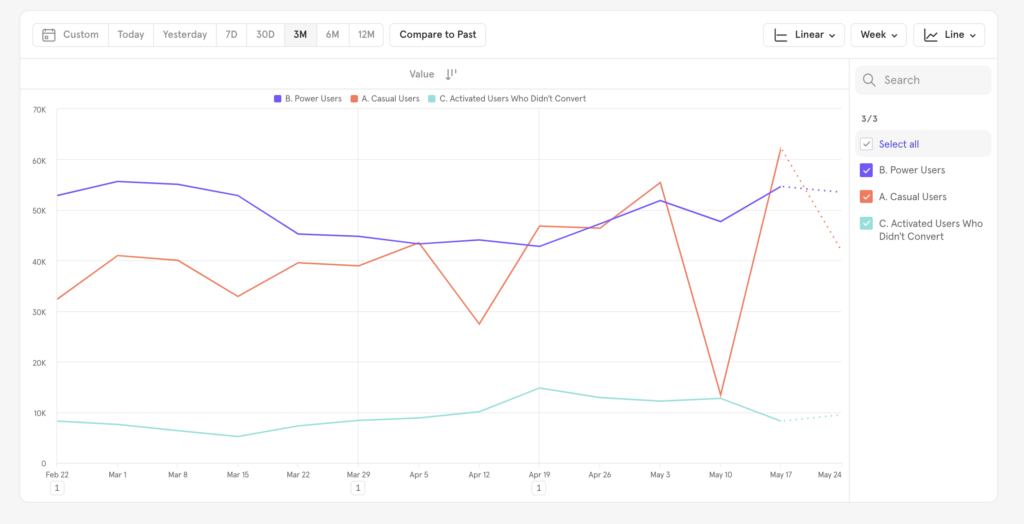
In order to improve a metric, you need to understand how it’s trending at any moment. Step one is to define the Growth KPI in your analytics tool. Usually, this is done through a cohort or segment builder by specifying behaviors and time constraints that qualify someone as an “active user.” The same applies to other metrics categories like engagement, activation, and so on.
Step two is to build a clear visualization of KPI performance over time. That way, if your boss stops by your desk, you can tell her exactly how many people ordered 3 or more glasses of lemonade in the past 7 days. You can even go one step further and share that the number is up 24% from last week, which is up 15% from the week before that.
You can read more about this process with our guide to growth through segmentation (focused on lifecycle analysis to understand your users).
It’s hard to imagine not having this type of insight, right?
You may be surprised to hear that Mixpanel is the only user analytics solution that enables you to plot a line chart of custom, multidimensional growth KPIs with frequency and time-based dimensions—and view your exact performance at any point in time.
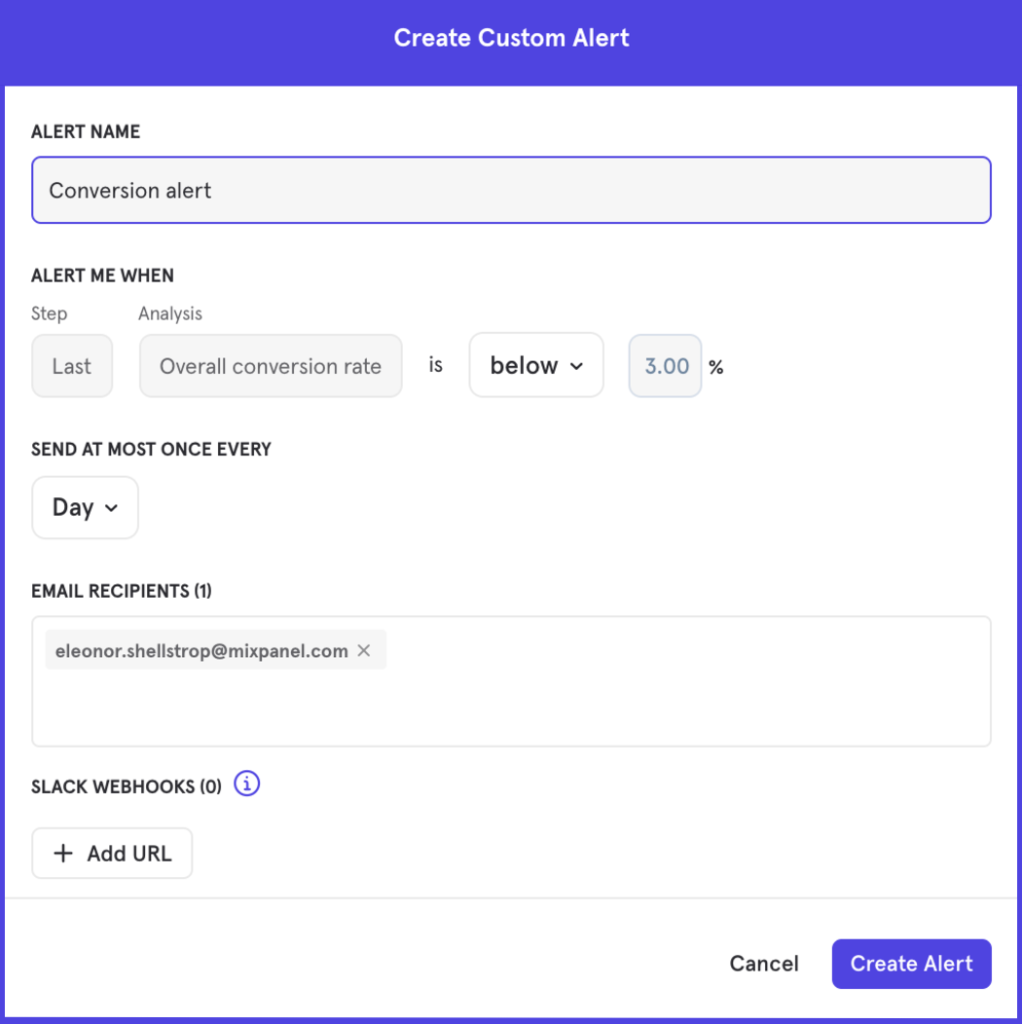
Monitoring for unexpected movement
Spikes and dips in metrics happen all the time, to all companies. What keeps you from being the failed lemonade stand is catching any negative changes right away, and quickly diagnosing why they happened, so you can take corrective actions.
In Mixpanel, you can achieve this by setting alerts for the metrics you care about and specifying a threshold for the level of change you want to be notified about. Set up custom alerts—by threshold and frequency—so you can spring into action with the most critical events and changes.
How to get started
If you’re building or marketing a product and you haven’t identified your growth KPIs, now is the time.
Our Guide to Product Metrics may spark some ideas, and if you’d like to hear how others in your shoes are selecting their metrics check out the conversations happening in the Mixpanel Community.
Give these resources a try and let us know what you think!